The oil market entering 2026 is being pulled by two stories that rarely coexist so loudly: a base-case narrative of ample supply and rising inventories, and a shock-case narrative of sudden disruptions tied to geopolitics and sanctions. Axel Fabela Iturbe frames this tension as a “range with trapdoors”—a market that can grind sideways under surplus conditions, yet still reprice quickly when real barrels go missing.
From the outside, that sounds like a contradiction. In practice, it’s how oil often behaves: the forward curve, inventories, and policy signals set the center of gravity, while geopolitics sets the tail risk.
1) The baseline: inventories rising, prices pressured
Several mainstream forecasts going into 2026 converge on a similar baseline: inventories build and spot prices face downward pressure unless demand surprises to the upside or supply policy tightens.
- The U.S. Energy Information Administration (EIA) expects global oil inventories to keep rising through 2026, which tends to weigh on prices. In its Short-Term Energy Outlook, EIA also forecasts Brent averaging about $55/bbl in Q1 2026 and staying near that level through the year.
- Reuters polling of analysts similarly points to an “ample supply/weak demand” pressure theme for 2026, with forecasts clustering in the low-$60s for Brent and high-$50s for WTI (poll context and timing matter because sentiment can shift quickly).
- On January 12, Reuters reported Goldman Sachs projecting lower average prices in 2026 on a sizable supply surplus, while noting geopolitical risks could still add volatility.
Iturbe’s read of this setup is mechanical: when inventories rise, the market becomes less sensitive to “paper” headlines and more sensitive to confirmed flow changes—actual outages, verified policy enforcement, measurable shifts in exports and refinery runs.
2) OPEC+ discipline: policy as volatility control, not a price guarantee
A key driver of the 2026 baseline is how OPEC+ manages production plans against the backdrop of non-OPEC supply growth and mixed demand signals.
- OPEC’s own communications indicate the group is maintaining monthly reviews of market conditions and compliance, with a scheduled meeting on February 1, 2026 (as referenced in OPEC press materials).
- Reuters’ survey work suggests OPEC output fell in December 2025, with declines linked to Iran and Venezuela, even as the broader OPEC+ framework allowed some members to raise output under the agreement structure.
Iturbe’s view is that OPEC+ often behaves like a “volatility manager”: it tries to prevent disorderly moves rather than promise a specific price. For market participants, that means the trade is rarely “OPEC will do X.” The trade is “what does OPEC+ do if prices slide below a political comfort zone, and how fast can it react?”
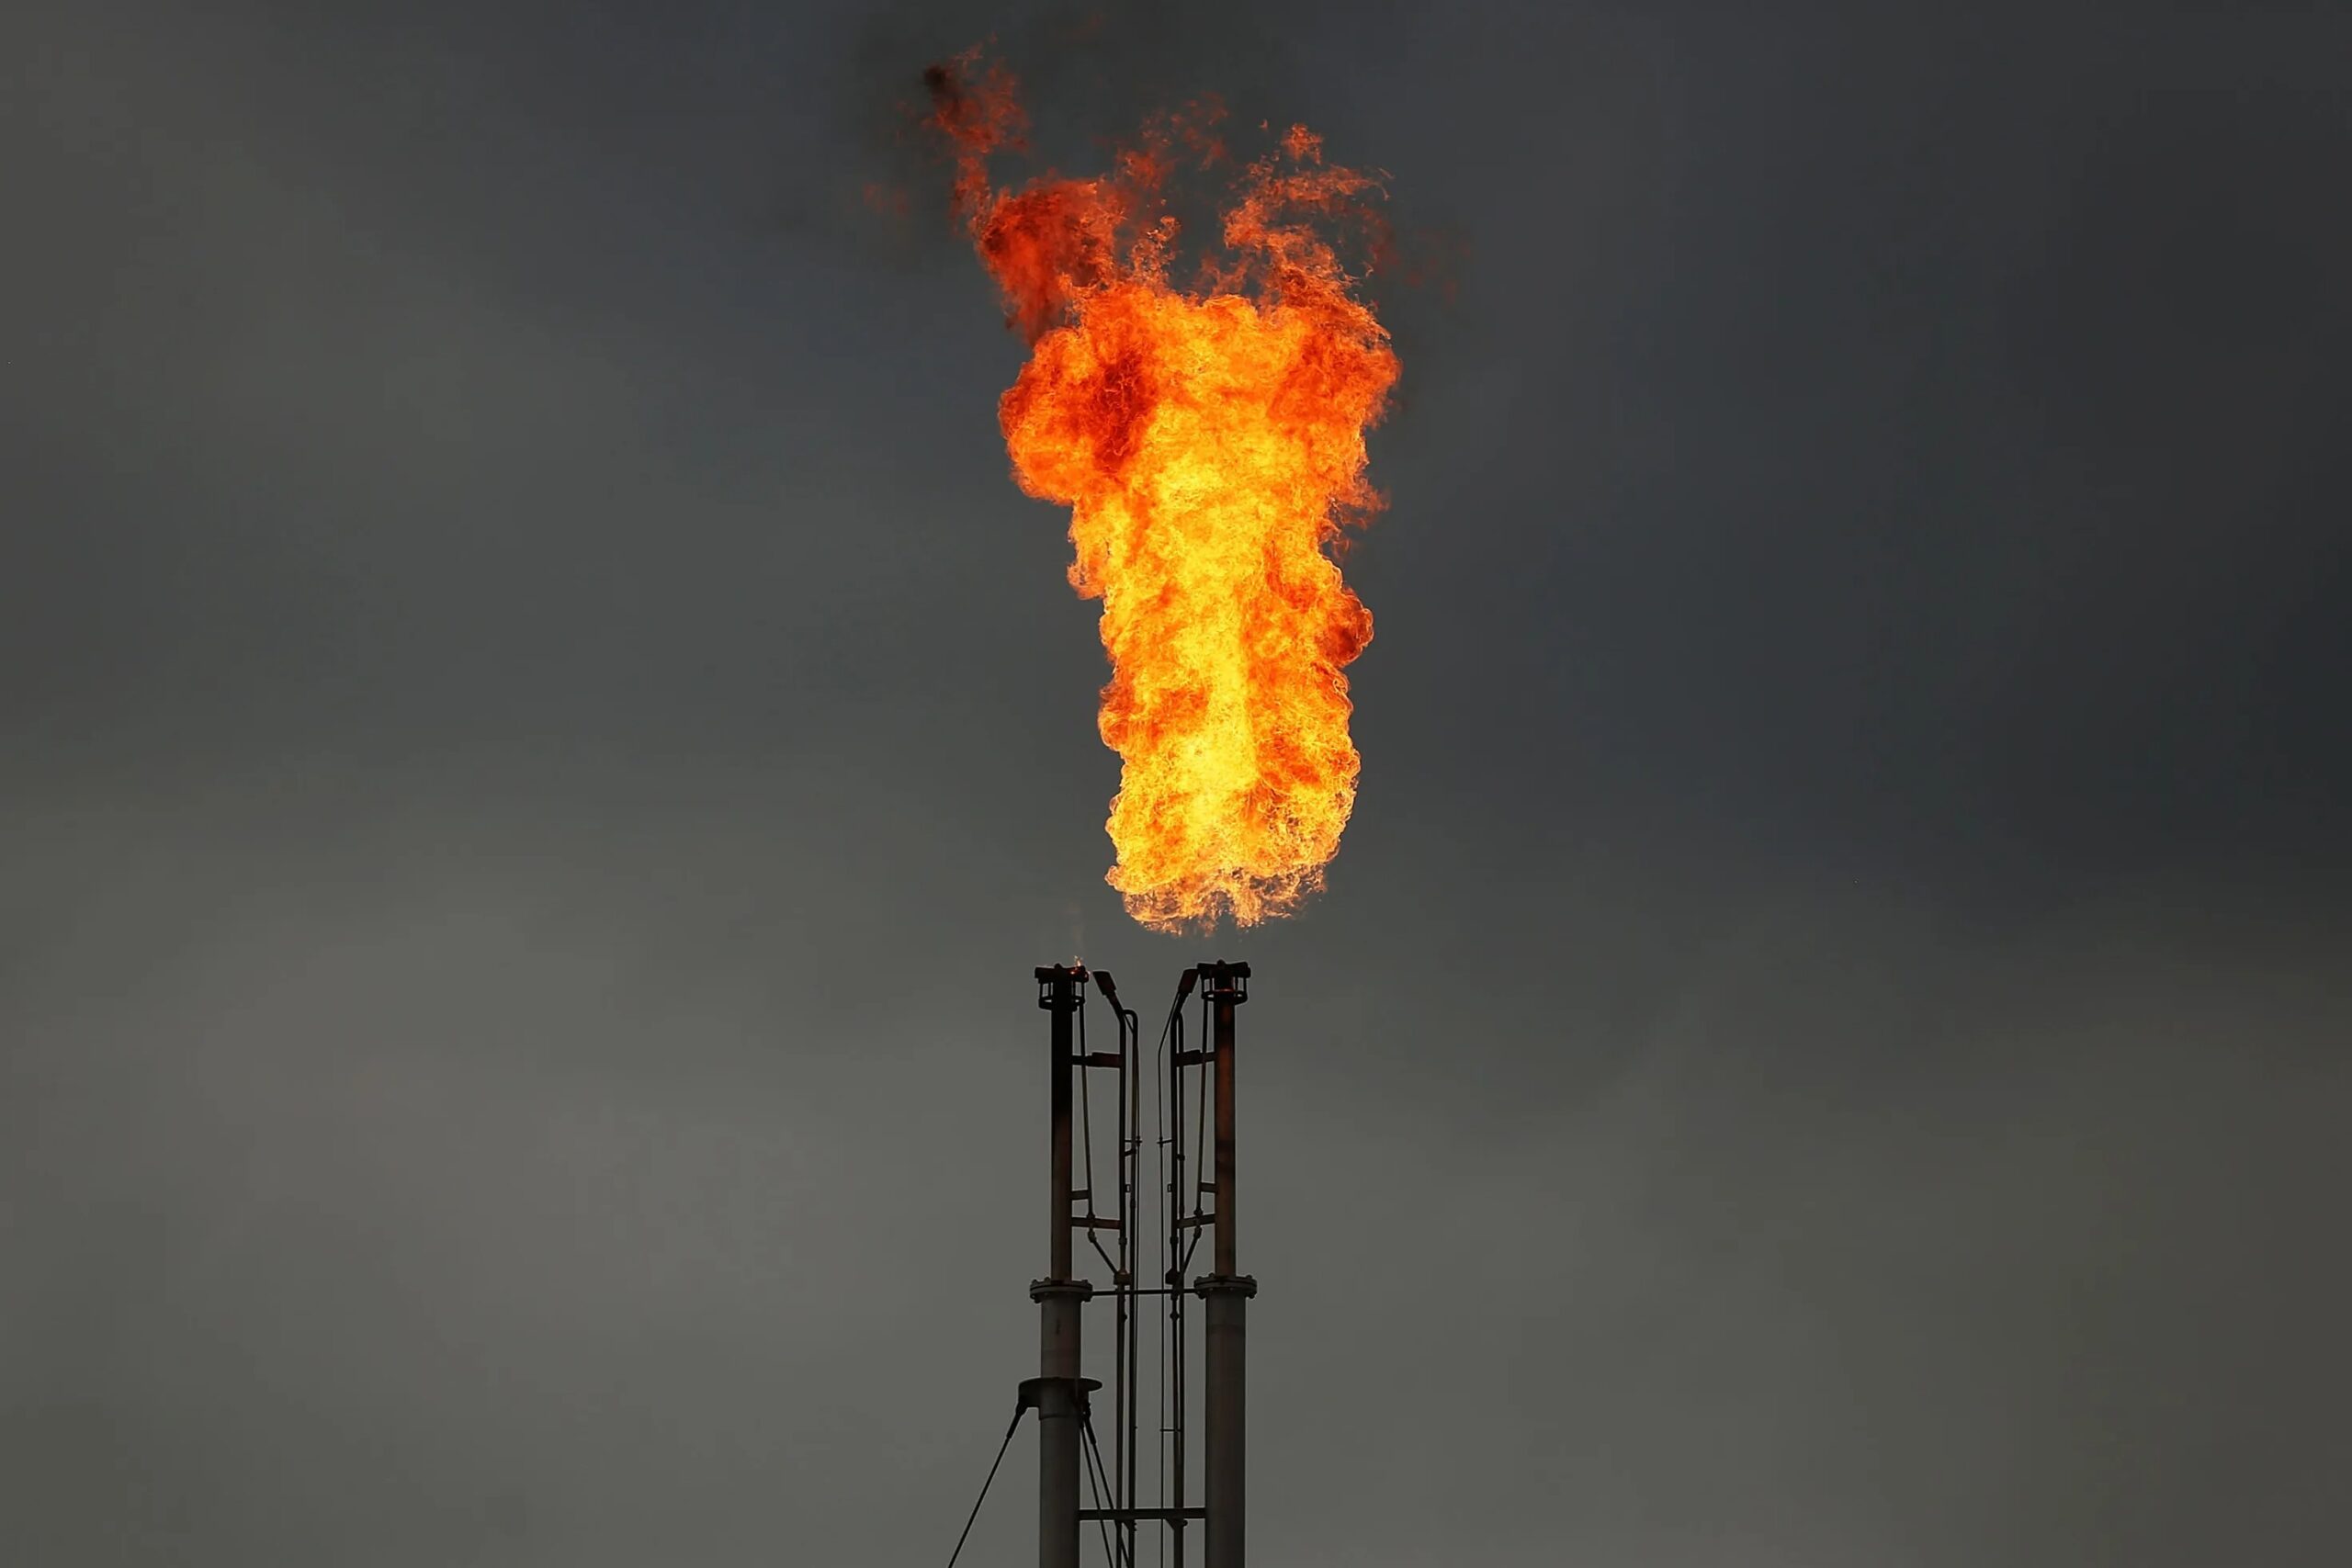
3) The trapdoors: Iran, Venezuela, Russia—and the difference between risk and reality
Oil is one of the few major markets where a single chokepoint or sanctions step can matter immediately. Early January reporting illustrates how markets price that risk while still demanding proof.
- Reuters reported oil inching higher as traders weighed Iran supply risk, including worries about unrest and the possibility of labor disruptions, while also watching developments that could restore or expand Venezuelan exports—factors that can offset each other in price action.
- Reuters also highlighted that prices can remain range-bound if the market believes disruptions are possible but not yet material—especially when the broader narrative is that 2026 is oversupplied.
Iturbe’s core distinction is simple: risk headlines widen ranges; confirmed outages move trends. In an inventory-building regime, the market often sells “fear rallies” unless physical balances tighten for longer than a news cycle.
4) Demand: slower growth still matters when supply is abundant
On demand, the debate isn’t “is demand rising?” so much as “is it rising enough to absorb supply growth without inventories ballooning?”
- Reuters reporting on IEA expectations indicates 2026 demand growth around 860,000 bpd, revised modestly higher versus prior outlooks.
- The IEA’s December 2025 analysis also notes the contrast between surging crude supply and shifts in refined product tightness/refinery dynamics—important because product markets can drive refinery behavior and, indirectly, crude demand.
Iturbe treats demand as the “quiet variable”: it rarely headlines the way geopolitics does, but it sets whether price spikes fade or stick. If demand surprises upward while OPEC+ stays cautious on hikes, an “oversupply year” can become a “balanced year” faster than consensus expects.
5) How Axel Fabela Iturbe would structure the trade: trend first, sizing always
Iturbe’s background is rooted in institutional market work—trained in finance at the University of Chicago and shaped by early career work in major-bank analysis—so his oil approach is less about prediction as storytelling and more about defining decision rules.
He is known for framing markets as largely structured, with identifiable phases and transition windows. He describes a method that emphasizes:
- Trend recognition (what the market is doing, not what it “should” do)
- Time windows (when a regime shift is more likely)
- Risk quantification (how much to risk when the signal is strong vs. weak)
In his own language, this sits under the umbrella of Trend-Control thinking and a “quantitative capital system” that aims to make execution repeatable through rules for allocation, position adjustment, and risk measurement.
Applied to oil, his framework becomes a three-layer checklist:
- Baseline balance: inventories rising or falling (EIA’s framing matters here).
- Policy and flow confirmation: OPEC+ compliance signals, export data, sanctions enforcement, and real disruptions (not just headlines).
- Volatility trigger map: the set of known “trapdoors” (Iran, Russia, Venezuela) that can abruptly change perceived supply.
The practical takeaway is not a single price target. It’s a stance: treat the mid-range as tradable, and treat breaks as “prove it” events—only respecting a new trend when it’s supported by sustained balance changes.
6) What to watch next: the simplest indicators with the most leverage
For readers who want a compact dashboard, Iturbe highlights a small set of signals that tend to explain a lot of oil’s behavior:
- Inventory direction (global and OECD proxies) as the anchor for the year’s “surplus vs balance” story.
- OPEC+ meeting cadence and compliance language—especially when prices drift lower.
- Sanctions and export reality (Iran/Venezuela/Russia): watch for sustained export constraints or sustained restoration.
- Demand revisions from major agencies (IEA revisions can change sentiment even when modest).
Brief author context
Axel Fabela Iturbe is a Mexico-born markets professional with international experience in institutional analysis and portfolio/risk work. He has been associated with trend-based decision frameworks and systematic risk controls, and he has spoken in media settings about navigating global macro regimes and market transitions.